%20%20--%3E%0A%3Csvg%20version%3D%221.1%22%20xmlns%3D%22http%3A%2F%2Fwww.w3.org%2F2000%2Fsvg%22%20xmlns%3Axlink%3D%22http%3A%2F%2Fwww.w3.org%2F1999%2Fxlink%22%20x%3D%220px%22%20y%3D%220px%22%0A%09%20viewBox%3D%220%200%201280.6%20200%22%20style%3D%22enable-background%3Anew%200%200%201280.6%20200%3B%22%20xml%3Aspace%3D%22preserve%22%3E%0A%3Cstyle%20type%3D%22text%2Fcss%22%3E%0A%09.st0%7Bfill%3A%23231F20%3B%7D%0A%09.st1%7Bfill%3A%23111111%3B%7D%0A%09.st2%7Bfill%3A%23FFB00D%3B%7D%0A%09.st3%7Bfill%3A%23FFFFFF%3B%7D%0A%3C%2Fstyle%3E%0A%3Cg%20id%3D%22Template%22%3E%0A%3C%2Fg%3E%0A%3Cg%20id%3D%22Layer_2%22%3E%0A%09%3Cpath%20class%3D%22st2%22%20d%3D%22M117.1%2C40.1c0-4.8%2C2.3-10%2C7-15.4c-0.3-0.3-10-7.9-29.3-22.7H7.5L7.4%2C2.1C2.5%2C17.1%2C0%2C24.7%2C0%2C25.1%0A%09%09c5.4%2C6.1%2C8.1%2C12.7%2C8.1%2C19.5v112.8c0%2C6.9-2.7%2C13.4-8.1%2C19.5c0.5%2C1.9%2C1.9%2C6.4%2C4.3%2C13.7c1.9%2C6.2%2C2.9%2C9.4%2C3.2%2C9.4h33.4l7.5-22.9%0A%09%09c-1.5-1.6-2.8-3.2-3.9-4.9c-2.9-5-4.3-9.7-4.3-14.1v-41h16.1l14.5%2C37.4c4.3%2C10.2%2C6.4%2C16.6%2C6.4%2C19.1v1.1c0%2C1.9-0.6%2C3.7-1.7%2C5.6%0A%09%09c0%2C0.4%2C0.3%2C1.1%2C1%2C2.1c4.8%2C8.9%2C8.1%2C14.8%2C9.9%2C17.6h32.5c0.1-0.7%2C1-8.4%2C2.7-23.2c-6-3.3-10.7-8.5-14.1-15.4%0A%09%09c-1.8-4.2-7.4-18.5-16.7-42.8c0-0.1%2C10.3-9.8%2C31-29.2c0-0.1-0.2-0.3-0.6-0.7c-2.9-1.9-4.3-5.3-4.3-10.3V74%0A%09%09C116.8%2C67%2C116.9%2C55.7%2C117.1%2C40.1z%20M84.9%2C75.1c-2.6%2C2.7-5.9%2C6-9.8%2C9.8H40.2V33.6h34.8c3.5%2C3.4%2C6.8%2C6.8%2C9.9%2C10V75.1z%22%2F%3E%0A%09%3Cpath%20class%3D%22st2%22%20d%3D%22M265.6%2C23.9c-3.3-10.6-5.2-16.3-5.4-17c-1.3-4.4-2-6.6-2.2-6.6h-33.2c-0.7%2C1.8-3.2%2C9.6-7.7%2C23.4%0A%09%09c1.2%2C1.3%2C2.4%2C2.8%2C3.5%2C4.5c3.2%2C5.2%2C4.7%2C10%2C4.7%2C14.5v117.1c-3.4%2C2.2-7.2%2C4.9-11.2%2C8.1h-26.5c-0.4-0.3-4.1-3-11.2-8.1%0A%09%09c-0.1-33.1-0.1-60.6-0.1-82.5V42.8c0-6.6%2C2.7-13.1%2C8.2-19.4c-1.3-4-2-6-2-6.1c-3.5-11.4-5.4-17-5.6-17h-33.6%0A%09%09c-4.9%2C15.2-7.4%2C22.9-7.4%2C23.2c1.1%2C1.3%2C2.3%2C2.7%2C3.5%2C4.3c3.1%2C5.2%2C4.6%2C9.8%2C4.6%2C13.8v71.2c0%2C11.2%2C0%2C27%2C0.1%2C47.6c0%2C4.8-1.7%2C9.5-5%2C14.1%0A%09%09c-1.4%2C1.7-2.1%2C2.7-2.1%2C2.9c0.4%2C0.2%2C10.1%2C7.7%2C29.3%2C22.6h68.5c19.6-15.1%2C29.4-22.7%2C29.4-22.7V177c-1.8-1.9-3.1-3.8-4-5.7%0A%09%09c-1.9-4.2-2.8-8.8-2.8-13.8c-0.1-16.5-0.1-29.2-0.1-38.1V43.8C257.4%2C36.8%2C260.2%2C30.2%2C265.6%2C23.9z%22%2F%3E%0A%09%3Cpath%20class%3D%22st2%22%20d%3D%22M453.1%2C24.6c-4.7-15.4-7.2-23-7.4-23h-33.5c-0.3%2C0-1.2%2C2.2-2.8%2C6.6c-29.3%2C77.4-44%2C116.2-44%2C116.3h-0.3%0A%09%09C336.5%2C48.4%2C321.9%2C9.9%2C321.4%2C8.7c-1.7-4.7-2.7-7.1-2.9-7.1h-33.5l-7.4%2C22.9v0.1c5.5%2C6.2%2C8.2%2C12.7%2C8.2%2C19.5v115%0A%09%09c0%2C0.7-0.2%2C1.8-0.6%2C3.5c-1.5%2C6-4%2C10.8-7.5%2C14.4c0.7%2C2.3%2C2.2%2C7.3%2C4.7%2C14.8c1.6%2C5.5%2C2.5%2C8.2%2C2.8%2C8.2h33.2l0.1-0.1L326%2C177%0A%09%09c-4.1-4.8-6.5-9-7.1-12.6c-0.8-0.9-1.3-6.4-1.3-16.5V90.9h0.1c0.5%2C1.2%2C7.2%2C19.4%2C20.2%2C54.7c3.3%2C7.8%2C5%2C14.1%2C5%2C19%0A%09%09c0%2C5.5-1.4%2C9.8-4.3%2C12.8c0.7%2C2.3%2C2.9%2C8.3%2C6.6%2C17.9c1%2C3.2%2C1.7%2C4.7%2C2%2C4.7h36.4c0.4-0.9%2C3.2-8.5%2C8.5-22.6v-0.1%0A%09%09c-2.8-3.1-4.2-7.3-4.2-12.7v-0.3c0-3%2C0.4-6%2C1.3-9.1l23.7-64.3h0.1v59.7c0%2C8.1-0.5%2C13.1-1.5%2C15.1c-0.9%2C3.5-3.2%2C7.3-6.7%2C11.3%0A%09%09c3.3%2C10.6%2C5.2%2C16.6%2C5.7%2C18c0.9%2C3.3%2C1.5%2C5%2C1.8%2C5h33.1l0.3-0.1l7.3-22.7V177c-0.9-1.1-2.1-2.7-3.6-4.6c-2.9-5.2-4.3-9.6-4.3-13.3%0A%09%09v-115C445%2C37.2%2C447.7%2C30.7%2C453.1%2C24.6z%22%2F%3E%0A%09%3Cpath%20class%3D%22st3%22%20d%3D%22M579.8%2C133.3c0-0.5%2C0-0.9%2C0.1-1.3c0.4-3.9%2C2.6-8.3%2C6.7-13.1v-0.1l-17-13.3c-2.3-1.5-4.1-3.2-5.3-5.2%0A%09%09c13.7-10.4%2C21.1-16.1%2C22.2-17.2l-2.4-2.9c-2.9-4.5-4.3-7.9-4.3-10.2V38.5c0-0.4%2C0-0.7%2C0.1-1c0.3-3.3%2C2.5-7.5%2C6.6-12.6v-0.1%0A%09%09l-14.4-11.2c-5.8-4.3-10.7-8.3-14.7-12h-84.9c-0.5%2C1.2-3%2C9-7.5%2C23.4l2.8%2C3.6c3.5%2C5.5%2C5.3%2C10.3%2C5.3%2C14.5v115.6%0A%09%09c0%2C0.5-0.1%2C1.5-0.4%2C3.2c-1.6%2C6.4-4.1%2C11.4-7.7%2C14.8c4.7%2C15.4%2C7.3%2C23.2%2C7.5%2C23.2h84.7c0.1%2C0%2C0.6-0.4%2C1.4-1.1%0A%09%09c18-13.9%2C27.3-21.2%2C28.1-21.9c-4.7-5.4-7-10.4-7-15.1V133.3z%20M547.7%2C158.1c-5.3%2C5.5-8.6%2C8.8-9.9%2C9.9H505v-51.2h32.9%0A%09%09c2.7%2C2.7%2C6%2C6%2C9.8%2C9.9V158.1z%20M547.7%2C74.8c-2.6%2C2.8-5.9%2C6.1-9.8%2C9.9H505V33.6h32.8c3.5%2C3.3%2C6.8%2C6.7%2C9.9%2C9.9V74.8z%22%2F%3E%0A%09%3Cpath%20class%3D%22st3%22%20d%3D%22M728.3%2C23.9c-3.3-10.6-5.2-16.3-5.4-17c-1.3-4.4-2-6.6-2.2-6.6h-33.2c-0.7%2C1.8-3.2%2C9.6-7.7%2C23.4%0A%09%09c1.2%2C1.3%2C2.4%2C2.8%2C3.5%2C4.5c3.2%2C5.2%2C4.7%2C10%2C4.7%2C14.5v117.1c-3.4%2C2.2-7.2%2C4.9-11.2%2C8.1h-26.5c-0.4-0.3-4.1-3-11.2-8.1%0A%09%09c-0.1-33.1-0.1-60.6-0.1-82.5V42.8c0-6.6%2C2.7-13.1%2C8.2-19.4c-1.3-4-2-6-2-6.1c-3.5-11.4-5.4-17-5.6-17H606%0A%09%09c-4.9%2C15.2-7.4%2C22.9-7.4%2C23.2c1.1%2C1.3%2C2.3%2C2.7%2C3.5%2C4.3c3.1%2C5.2%2C4.6%2C9.8%2C4.6%2C13.8v71.2c0%2C11.2%2C0%2C27%2C0.1%2C47.6c0%2C4.8-1.7%2C9.5-5%2C14.1%0A%09%09c-1.4%2C1.7-2.1%2C2.7-2.1%2C2.9c0.4%2C0.2%2C10.1%2C7.7%2C29.3%2C22.6h68.5c19.6-15.1%2C29.4-22.7%2C29.4-22.7V177c-1.8-1.9-3.1-3.8-4-5.7%0A%09%09c-1.9-4.2-2.8-8.8-2.8-13.8c-0.1-16.5-0.1-29.2-0.1-38.1V43.8C720.1%2C36.8%2C722.8%2C30.2%2C728.3%2C23.9z%22%2F%3E%0A%09%3Cpath%20class%3D%22st3%22%20d%3D%22M864%2C36c0.8-4%2C3.2-8.2%2C7.1-12.6c0-0.5-2-7-6.1-19.7c-0.7-2.5-1.1-3.8-1.4-3.8h-33.2L823%2C23.2%0A%09%09c1.2%2C1.3%2C2.4%2C2.8%2C3.5%2C4.6c3.1%2C5%2C4.6%2C9.4%2C4.6%2C13.1v79.4h-0.1c-0.1-0.5-13.5-35.3-40.3-104.5c-3.8-10.2-5.9-15.5-6.1-15.8H748%0A%09%09l-7.4%2C23c0%2C0.3%2C0.1%2C0.5%2C0.3%2C0.7c5.3%2C6%2C8%2C12.6%2C8%2C19.5v104.5c0%2C3.7-0.3%2C8-0.8%2C13c-0.7%2C5.3-3.3%2C10.5-7.8%2C15.6c0%2C0.4%2C1.3%2C4.5%2C3.9%2C12.3%0A%09%09c2.3%2C7.5%2C3.6%2C11.3%2C3.9%2C11.3h33.6l7.7-23.7c-3.4-4.2-5.6-7.7-6.6-10.6c-1.3-2.7-2-8.5-2-17.4V79.8h0.1%0A%09%09c20.1%2C52.5%2C33.6%2C87.6%2C40.6%2C105.4c3.6%2C9.9%2C5.5%2C14.8%2C5.7%2C14.8h36.1l7.5-23.2c-1-1.1-2.3-2.8-3.9-5c-2.7-5-4-8.9-4-11.6V41.6%0A%09%09C863%2C40.3%2C863.4%2C38.4%2C864%2C36z%22%2F%3E%0A%09%3Cpath%20class%3D%22st3%22%20d%3D%22M897.9%2C3.2c-0.6%2C0.8-7.8%2C14.7-21.6%2C41.5c0%2C0.1%2C0.4%2C0.5%2C1.1%2C1.1c8.9%2C5.2%2C14.8%2C8.7%2C17.6%2C10.6h0.3%0A%09%09c2.8-4.2%2C6.3-8.4%2C10.5-12.7c6.8-5.9%2C13.9-8.8%2C21.2-8.8h11v121.8c0%2C7-2.7%2C13.4-8.1%2C19.4c1.9%2C6.1%2C3.2%2C10.1%2C3.9%2C12%0A%09%09c2.3%2C7.9%2C3.6%2C11.9%2C3.9%2C11.9h32.5l0.1-0.1c0.4-0.7%2C2.9-8.6%2C7.7-23.6c-5.4-6.2-8.1-12.7-8.1-19.5V34.9h11c3.7%2C0%2C7.6%2C0.9%2C11.6%2C2.7%0A%09%09c3.1%2C1%2C6.6%2C3.4%2C10.5%2C7.1c3.7%2C3.7%2C6.9%2C7.6%2C9.6%2C11.7c0.4%2C0%2C6.7-3.9%2C19-11.6c-13.8-26.8-21-40.7-21.6-41.6H897.9z%22%2F%3E%0A%09%3Cpath%20class%3D%22st3%22%20d%3D%22M1101.3%2C32.5c5.1%2C0%2C10.4%2C1.5%2C15.9%2C4.6c2.1%2C1.5%2C4.2%2C3.1%2C6.1%2C4.7c3.8%2C3.9%2C7.3%2C8%2C10.3%2C12.4%0A%09%09c0.7-0.2%2C7-4.1%2C19.1-11.7c-10.9-21-16.5-31.9-16.9-32.5c-3-6-4.7-9.3-5.2-9.6h-58.5c-6.1%2C0-15.9%2C0-29.2-0.1l-7.4%2C23%0A%09%09c0%2C0.2%2C0.1%2C0.4%2C0.4%2C0.6c5.2%2C6%2C7.8%2C12.6%2C7.8%2C19.5v114c0%2C2.7-0.6%2C5.7-1.8%2C9.1c-1%2C3.2-3.2%2C6.6-6.4%2C10.3c2.4%2C8%2C4.4%2C14%2C5.9%2C18%0A%09%09c0.9%2C3.4%2C1.5%2C5.2%2C1.8%2C5.2h44.1c10%2C0%2C24.5%2C0%2C43.4-0.1l21.9-42c0-0.2-0.5-0.6-1.4-1.1c-8.7-5.3-14.6-8.9-17.6-10.9l-3.8%2C4.9%0A%09%09c-2.1%2C3.2-5.6%2C6.7-10.3%2C10.7c-6.1%2C4.2-12.2%2C6.3-18.1%2C6.3h-25.4c0.1-17.7%2C0.1-31.4%2C0.1-41.3v-9.9h35.6l0.1-0.1%0A%09%09c-3.4-15.7-5.2-23.6-5.3-23.6c-1.1-5.8-1.8-8.7-2.1-8.7h-28.3c-0.1-15.2-0.1-26.8-0.1-35V32.5H1101.3z%22%2F%3E%0A%09%3Cpath%20class%3D%22st3%22%20d%3D%22M1278.3%2C89.5c0-0.1-0.2-0.3-0.6-0.7c-2.9-1.9-4.3-5.3-4.3-10.3V74c0-7%2C0.1-18.3%2C0.3-33.9c0-4.8%2C2.3-10%2C7-15.4%0A%09%09c-0.3-0.3-10-7.9-29.3-22.7h-87.2l-0.1%2C0.1c-4.9%2C15-7.4%2C22.7-7.4%2C23c5.4%2C6.1%2C8.1%2C12.7%2C8.1%2C19.5v112.8c0%2C6.9-2.7%2C13.4-8.1%2C19.5%0A%09%09c0.5%2C1.9%2C1.9%2C6.4%2C4.3%2C13.7c1.9%2C6.2%2C2.9%2C9.4%2C3.2%2C9.4h33.4l7.5-22.9c-1.5-1.6-2.8-3.2-3.9-4.9c-2.9-5-4.3-9.7-4.3-14.1v-41h16.1%0A%09%09l14.5%2C37.4c4.3%2C10.2%2C6.4%2C16.6%2C6.4%2C19.1v1.1c0%2C1.9-0.6%2C3.7-1.7%2C5.6c0%2C0.4%2C0.3%2C1.1%2C1%2C2.1c4.8%2C8.9%2C8.1%2C14.8%2C9.9%2C17.6h32.5%0A%09%09c0.1-0.7%2C1-8.4%2C2.7-23.2c-6-3.3-10.7-8.5-14.1-15.4c-1.8-4.2-7.4-18.5-16.7-42.8C1247.3%2C118.5%2C1257.6%2C108.8%2C1278.3%2C89.5z%0A%09%09%20M1241.4%2C75.1c-2.6%2C2.7-5.9%2C6-9.8%2C9.8h-34.9V33.6h34.8c3.5%2C3.4%2C6.8%2C6.8%2C9.9%2C10V75.1z%22%2F%3E%0A%3C%2Fg%3E%0A%3C%2Fsvg%3E%0A)

Pittsburgh Pirates: 10 Single Season Stats Worth a Deeper Dive


Because the Pittsburgh Pirates have been around as long as they have, there are bound to be interesting tidbits in their history. These 10 single season stats might standout in the crowd.
The Pittsburgh Pirates have been around for a long time. They officially became an MLB team in 1887, and have remained in the National League since. They have a long, storied history behind them including playing in the first World Series, and owning some of the best players to ever step onto a baseball field.
Playing for so long is bound to make interesting stories. Old or new, stats can tell a great story, and ones that really make you look twice at a player. So today, let’s take a look at some really interesting statlines that have since developed throughout the history of the Pittsburgh Pirates. There have been plenty of times in the franchise’s history that have made for interesting looking numbers.
18-1
Pitching record has been part of baseball for nearly its entire existence, but is an awful way to identify a good or bad pitcher. It solely relies on the ability of your offense to score runs. For example, A.J. Burnett went 10-11 in 2013 despite giving up more than four earned runs just six times across his 30 starts. Overall, he was a lot better in 2013 than he was in 2012, but went 16-10 in 2012.
Seven, one run innings can be a loss just as easily as 6 innings of four run ball can be a win. It’s even worse for relief pitchers as they can give up a lead, yet still get a win if the offense can take the lead the next time they come to the plate.
Because this stat can be so easily manipulated by factors out of the pitcher’s control, there’s bound to be multiple times when something different has happened with it that has created an interesting single season pitch record. That’s what happened to Roy Face 1959.
Roy Face was the first ever closer for the Pittsburgh Pirates. He was the first Pirate in history to record double digits in saves that being in 1957. Two years later in 1959, Face pitched in 93.1 innings, posting a 2.70 ERA, 2.60 FIP and 1.24 WHIP. He only walked 6.6% of the batters he faced, surrendered only five home runs, and posted a 18.2% strikeout rate, and while that doesn’t seem very high in today’s game, it was really good for thr 50s and 60s. For the era, he had a 70 ERA- and 69 FIP-, showing he was well above average.
But Face had an 18-1 record, as a relief pitcher. It’s the seventeenth most wins in a single season in Pirate history, but the most wins by a relief pitcher in a single season with no starts. In four of those 18 wins, Face blew the save, but still got the win because the offense bailed him out in the next inning. It just goes to show how much an offense can easily manipulate pitcher records.
Regardless, the flaws in how the stat is recorded helped Face record a whopping 18 wins. It’s interesting to think how lucky Face got, pitching in the right place at the right time.
198
Weighted runs created plus, or wRC+, is arguably the best way to look at a player’s offensive contributions. It is adjusted for items such as the era a player played in, and the park they played in. Run environments across history have been so different. Obviously the deadball era is much different to the run environment in 2019. Hitting well in a hitter friendly park is much easier than hitting well in a pitcher friendly park, and wRC+ is adjusted for things like this. 100 is always average, and any point above or below it is 1% above/below average.
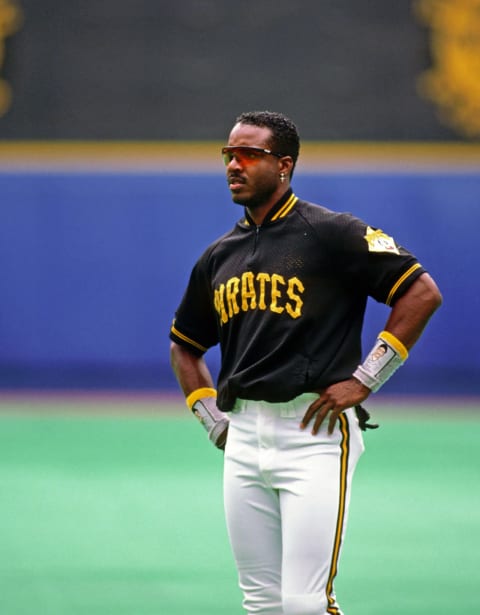
Barry Bonds is such an outlier in the context of this stat in the era he played in. In 1992, Bonds hit .311/.456/.624 with 34 long balls and a .459 wOBA. Impressively, he walked 20.8% of the time. Bonds was a five tool player. He hit for power, stole 39 bases, had +4 total zone runs above average, and showed off a decent arm, except in the playoffs. Still, overall easily the MVP that season. His fWAR of 9.6 was well ahead of the man in second place, Ryne Sandberg at 7.4.
His 198 wRC+ is insane. That essentially means he was almost 100% better than the league average. It’s the highest single season mark in Pittsburgh Pirates history. Arky Vaughan’s 1935 and Honus Wagner’s 1908 seasons come in second at 194. What’s even more insane is that this isn’t even close to Bonds’ best single season in his career.
From 2001 to 2004, his lowest single season wRC+ was 212, and his highest was 244. Whether you love him or hate him, everyone can admit that watching Bonds play was like watching someone put MLB The Show on rookie difficulty and just going to town on pitchers.
46
Saves are like pitcher wins and losses. They don’t really identify who’s a good or bad relief pitcher. Sometimes, bad relief pitchers can rack up a handful of saves, and the best relief pitcher doesn’t always get the chances to save games.
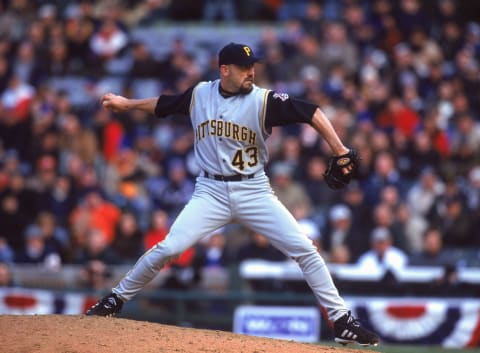
In 2002, the single season save record in Pittsburgh Pirates franchise history was set at 46, breaking the previous record of 33 set by Jim Gott in 1988. That record was set by right hander Mike Williams.
Williams wasn’t an absolutely dominant relief pitcher like you think he would be. In 61.1 innings, the closer had a 2.93 ERA, 3.91 FIP and 1.22 WHIP. Williams only struck out 16.1% of the batters he faced, but had a walk rate of 8.1%. His home run rate of 0.88 was solid, but not overly impressive. This is shown in his FIP and 3.99 xFIP.
His 0.4 fWAR isn’t great either. These numbers aren’t awful, but I’m sure if you were presented with them, you wouldn’t have guessed they came from a season where Williams posted a top 50 save total season.
Williams might also own the worst season by a National League All-Star. The following year in 2004, Mike surrendered 26 earned runs in his first 37.1 innings, and walked more batters than he struck out with a 20/22 BB/K ratio. Despite this, he still made the All-Star game, possibly because of his saves total. Eventually, he was traded to the Phillies for Frank Brooks.
The record was eventually broken by Mark Melancon in 2015 with 51 saves. He put up a truly dominant season for the Bucs with a 2.23 ERA, 2.82 FIP and 0.92 WHIP.

12
Runs batted in, or RBI, are essentially a batter’s version pitcher wins/losses. They can be majorly affected by forces outside of an individual player’s control, and don’t accurately tell how productive a player is.
If you are a middle of the order bat, then you’re going to have a lot more RBIs than if you hit lead off, regardless of how good you are with runners in scoring position, or how good you are with men on base simply because you’re going to have way more chances. RBI totals almost completely rely on where a hitter hits in the line up, how many chances they get, and who hits in front of them.
Obviously, a number two or number three hitter will have a lot more RBIs if the team leads off a guy with a .400 on base percentage over a guy with a .330 OBP. Leadoff guys, even if they are extrmely good with men on, will almost never have high RBI totals. Because of how easily they can be manipulated, some odd things can happen. This is the case with the lowest RBI total across an entire season since the start of the 1900’s.
In 1907, the Pittsburgh Pirates used a guy named Goat Anderson in the outfield quite often. This is the first and only year of his MLB career, and in 513 plate appearances, Anderson hit .206/.343/.225 with a 77 OPS+ and 89 wRC+. Despite playing in over 100 games, and receiving fairly regular playing time, Anderson had just 12 RBIs. Just to show how few that is, the lowest amount of RBI’s in 2019 across at least 500 plate appearances was Mallex Smith a 37. Even in the shortened 60 game season in 2020, only one player out of 142 had both a qualifying amount of plate appearances and less than a dozen RBIs.
Now granted, he was the Pirates’ lead off hitter as 467 of his 513 plate appearances came in the number one spot of the order. However, 12 RBIs is the lowest total in Pirates’ history across at least 500 plate appearances. To have that many plate appearances, and just 12 RBIs is an insanely hard feat. It might even be harder to have this low of an RBI total, than have an RBI total over 100. What’s even more impressive is he did it on a team that was second in baseball in on base percentage at .325.

.475
Batting average on balls in play sounds like what it is. How often a ball put in play by a batter turns into a hit. Home runs are not part of BAbip as the formula is hits-home runs/at bats-strikeouts-home runs+sac flies. It can be a good indicator of luck for a pitcher or a batter. Usually, anything above .350 is unsustainable, and anything below .250 is usually lucky/unlucky.
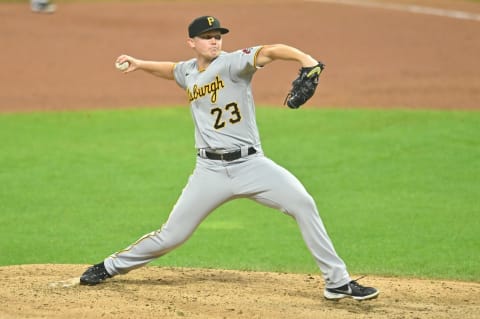
If you want the definition of weird, Mitch Keller’s MLB career so far has been it. In 2019, he was probably the most unlucky pitcher in baseball history. But what fueled his 2019 bad luck was an unsustainably high .475 opponent batting average on balls in play.
Keller’s .475 BAbip in 48 innings isn’t just the highest in Pirate history among pitchers with at least 40 innings, but the highest all time among pitchers with at least 40 innings in a single season. The next closest is Joe McDermott, who posted a .440 opponent BAbip in 63 innings with the Brooklyn Eckfords in 1872. In the last 100 years Trevor Rosenthal comes next at .425 in 2016. A lot of Keller’s poor BAbip can be attributed to the Pirates’ poor defense in 2019.
This high BAbip was the main backing of a 7.13 ERA, but Keller also had strong peripherals including a 3.19 FIP, 3.78 SIERA and 3.47 xFIP. He also struck out 28.6% of the batters he faced, walked just 7% of them, surrendered home runs at a solid 1.1 per 9 rate, and put up a strong 87.2 MPH exit velocity.
.104
We’re not done talking about Mitch Keller just yet. Keller went from one end of the luck spectrum to the complete opposite end in just the next year, culminating in what’s been an extremely weird roller coaster career so far for the young right hander.
Keller somehow posted a .104 batting average on balls in play across 21.2 innings. This helped him put up a 2.91 ERA, despite having a 1.66 HR/9, surrendering more walks than batters struck out. Keller can thank his low BAbip ironically because of the amount of homeruns runs given up, as home runs don’t help or hurt the stat.
This is by far the lowest BAbip by any pitcher with at least 20 innings pitched in a single season. The next closest is George Spencer of the 1950 San Francisco Giants at .114.
All of this weirdness has been previsosuly looked into deeper by Marty Leap.
Now granted, you need more than just 21.2 innings, or 48 innings to get an accurate BAbip reading. Small sample sizes can cause massive outliers. However, that shouldn’t take away from the fact of how Keller went from such an unlucky state to such a lucky state in consecutive seasons.
8
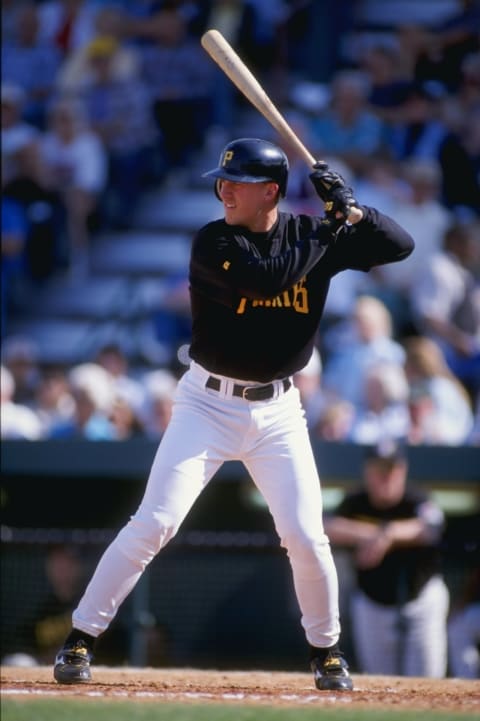
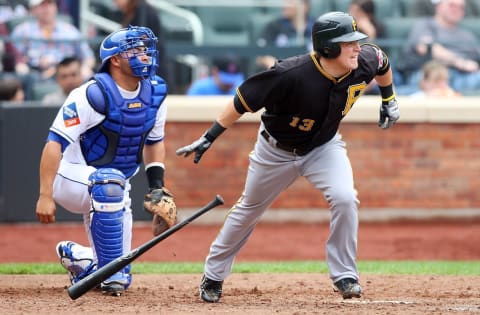
We talked about how good Barry Bonds was with the Pittsburgh Pirates in 1992 with his 198 wRC+, making him the most productive batter in a single season in Pittsburgh Pirate history. But what about the other side of the spectrum? What is the most unproductive season in Pittsburgh Pirates’ history? If we limit it to Pirate seasons with at least 200 plate appearances, it would be Doug Strange who has an ironically fitting name.
Strange played just one season with the Pittsburgh Pirates, that being in 1998. He was your run of the mill, light hitting, defensive replacement kind of guy. Before latching on with the Pittsburgh Pirates, he was a career .240/.304/.351 hitter with a 73 wRC+, but +2.8 defensive WAR across 1868 career games. However, his batting numbers from previous years would look like silver slugger worthy years compared to his 1998 season.
In 201 plate appearances, Strange was a .173/.217/.216 hitter with no home runs. This all came together in the single lowest wRC+ mark in Pirate history at 8. He was 92% worse than the average hitter. 23 pitchers in 1998 out hit Strange, and 12 hit more home runs than him. In 2019, 23 pitchers again would have out hit the infielder.
-63.1
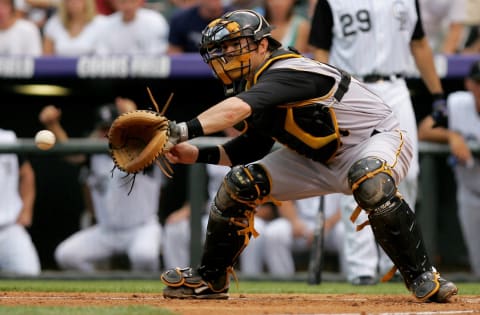
Framing has become a measurable skill for catchers in recent seasons. It’s a valuable trait that has always been in baseball to some degree for its entire history, but now with sites like FanGraphs and Baseball Prospectus, scouts and front offices have been able to put a quantifiable number on just how valuable framing can be.
According to FanGraphs’ framing runs metric, Ryan Doumit has the lowest all-time total since it’s introduction to baseball in 2008. Doumit was not a bad batter for the Pittsburgh Pirates. From 2007 through 2011, Doumit posted a .280/.337/.454 batting line, 111 OPS+ and 109 wRC+. He also put up a solid .343 wOBA. He was actually one of the best catchers in the league when it came to his batting prowess as in that five season span, he ranked 7th in wRC+ and 8th in wOBA among his other peers.
In 2008, Doumit was quite the offensive force. In 465 plate appearances, he hit .318/.357/.501 with 15 home runs and a strong 123 wRC+. Among catchers with at least 450 plate appearances, only Brian McCann and Joe Mauer were ahead of Doumit. But defensively, Doumit was costing the Pirates runs on every pitch that was tossed to him.
Now when you look at the DRS total and caught stealing numbers, you probably would think that Doumit wasn’t all that bad. -1 DRS and 27% caught stealing is roughly average. But in FanGraphs’ pitch framing metric, he cost the Pirates 63.3 runs. At -63.3 framing runs, no catcher has come within even halving that number.
The second lowest of all time is Jarrod Saltalamacchia at -31.6 runs, being worth an overall double the amount of runs of what Doumit was worth. While watching old video of Doumit in 2008, it was clear why he was costing the Pirates so many runs. Sometimes on low pitches, he wouldn’t even make an attempt at framing it, even if it was just slightly out of the zone.

99
Today, we have stats like defensive runs saved, outs above average, range runs above average, and ultimate zone rating to give us an accurate reading of how good a player is defensively. These were created to solve one issue: the amount of errors in errors.
There is no concrete definition as to what an error is in baseball. An error is decided by a scorer, so it’s definiton can change from play to play. Errors are extremely inaccurate anymore to identify good and bad fielders. Good fielders actually make more errors as they make more difficult plays more often than average/below average fielders. Bill Mazeroski has the 4th most errors by a second baseman, Ozzie Smith has the 11th most errors by any shortstop, and Brooks Robinson has the 4th most errors by any third baseman (all since 1950), yet the three are regarded as the best defensively at each position.
Because of the lack of a real definition for an error, many good fielders have put up awful error totals, like Honus Wagner having 5, 50+ error seasons. But the highest single season error total of all time Pirates history belongs to Frank Shugart of the 1892 Pittsburgh Pirates. Shugart was a decent batter for the Pirates, hitting .267/.329/.352 with 28 stolen bases. For the era, this was actually pretty good as he registered a 105 OPS+ and wRC+.
Shugart’s primary position with the Pirates was shortstop. He had seen a little bit of time in the outfield, and even a few innings behind the dish. But in 1892, Shugart committed 99 errors. Now granted, overall he wasn’t a bad fielder with +0.9 defensive WAR.
In Pirates’ history, it’s by far the highest number of errors recorded in a single season. Shugart played in 1170 innings at short, and 134 games. The next highest total is Monte Cross in 1895 who recorded 77 errors at short as well. He averaged an error nearly every .738 games that year. It’s not the highest total ever, as that title belongs to Billy Shindel of the 1890 Philadelphia Athletics at 119, but Shugart’s total ranks as the 14th most in a single season. In all fairness though, most baseball gloves during this time didn’t have webbing in between each finger. Some didn’t even have the webbing between the thumb and forefinger, or even leather covering the fingers for that matter, and looked more like a glove you’d find on a construction site today.
-23
Like I said earlier, defensive runs saved, or DRS is one of the many ways we identify who’s a good fielder and who isn’t a good fielder in today’s game. One of the worst defensive seasons by a Pirate was oddly enough one of the year’s they won a Gold Glove.
In 2008, Nate McLouth was the lone all-star for the Pittsburgh Pirates after batting .276/.356/.497 with 26 long balls and 23 stolen bases. All told, he had a 121 wRC+ and .364 wOBA in 685 plate appearances. With numbers like this, McLouth was one of the top offensive center fielders in the National League ranking second in wRC+, wOBA, OPS and home runs. Only Mets’ slugger Carlos Beltran outpaced McLouth in those four catergories.
Examining Kevin Newman's 2020 regression. dark. Next
But defensively, McLouth was awful. He had -23 defensive runs saved, -13.4 total zone runs above average, and -15.1 range runs above average. McLouth’s DRS total is the second lowest in Pirate history, only being outdone by Andrew McCutchen in 2016 at -26. Since the stat’s introduction to baseball in 2003, McLouth’s -23 DRS is the 6th lowest mark by any centerfielder. But somehow, McLouth took home the Gold Glove Award despite the fact Beltran reached double digits in DRS, UZR and range runs, and Shane Victrino reached double digits in DRS as well.