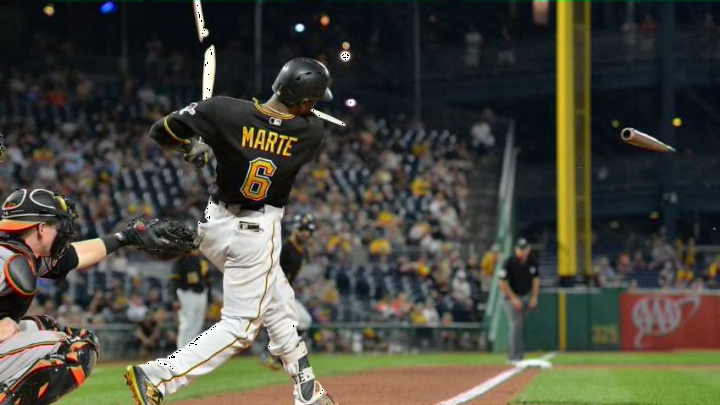
The Pittsburgh Pirates released their opening day lineup, and the biggest surprise was Starling Marte appearing in the six spot.
Starling Marte is the Pittsburgh Pirates best offensive player, almost hands down. Over the last five years, the Pirates center fielder has had one season in which he was below average – this past one where he was suspended 80 games – and four seasons in which he was at least 15 percent above average (wRC+). He has consistently slugged over .440, once again save 2017, and the two highest non-pitcher league average slugging percentages are .433 and .425, occurring in 2017 and 2016 respectively. Marte is clearly an above average hitter, yet he is batting sixth when the Pirates open up Thursday.
The traditional school of thought says to bat your best hitter third, stemming from the idea that the leadoff guy gets on, two-hole hitter moves him over, and then the best hitter drives him in. The analytical thought is to bat your best hitter second because they get more opportunities as the three hitters. Either way, the thought is to get your best hitter up there in one of the first three spots, ultimately guaranteeing a plate appearance in the first inning.
However, when the Pirates released their opening day lineup, Starling Marte is in the six spot. Whether going with the old school thought of a lineup, or by the analytical method, Marte should not be batting so low in the order. Let’s put some numbers on explaining why.
Baseball-Reference’s play index comes in handy, as the split finder allows the sum of the plate appearances on a league scale. Dividing those plate appearances by games started (generally around 4860 because 162*30), and that gives plate appearances per game:
| Row Labels | 2013 | 2014 | 2015 | 2016 | 2017 | Grand Total |
| Batting 1st | 4.65 | 4.63 | 4.63 | 4.65 | 4.67 | 4.65 |
| Batting 2nd | 4.55 | 4.52 | 4.51 | 4.55 | 4.55 | 4.54 |
| Batting 3rd | 4.44 | 4.42 | 4.41 | 4.43 | 4.45 | 4.43 |
| Batting 4th | 4.34 | 4.32 | 4.31 | 4.33 | 4.35 | 4.33 |
| Batting 5th | 4.24 | 4.22 | 4.21 | 4.24 | 4.24 | 4.23 |
| Batting 6th | 4.13 | 4.11 | 4.11 | 4.13 | 4.14 | 4.12 |
| Batting 7th | 4.01 | 3.99 | 3.99 | 4.01 | 4.03 | 4.01 |
| Batting 8th | 3.90 | 3.88 | 3.87 | 3.90 | 3.90 | 3.89 |
| Batting 9th | 3.77 | 3.75 | 3.75 | 3.77 | 3.79 | 3.77 |
Over the course of the last five seasons, the two spot in the order has come up 0.42 more times a game than the six spot. The three hole 0.31 times more per game. Multiplying those numbers by 162, or the games played in a season, results in 68.04 more plate appearances for the two hitter and 50.22 more for the three hitter compared to the six spot.
Furthermore, the two hitter has had 2130 more plate appearances with runners on base than the six hitter has had over the last five seasons. Over the total 24,296 team games played (12,148 actual games) that equates to 0.088 plate appearances a game for each team, or 14 plate appearances a season.
Next: 2018 Pirates Preview: Nick
Marte might be only hitting sixth for one game, just to start off the season, but it’s a decision that makes no sense. The Pirates need to create value, runs, and wins any way they can. With the club rolling with Marte in the six spots, the Pirates are losing about 68 plate appearances in a season compared to if they bat him second, and that comes with 14 fewer plate appearances with runners on base. That is a problem, and hopefully, this is just a one-off adventure for Marte and Clint Hurdle‘s lineup construction.
*Numbers calculated from Baseball-Reference’s play index and Fangraphs‘ splits leaderboard
