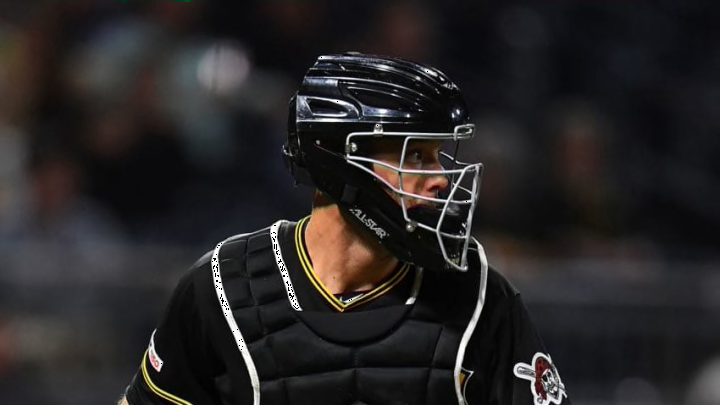
Last season, the Pittsburgh Pirates had one of the most disappointing starting rotations paired with the worst defense in baseball. With an emphasis on defensive play under the new front office, could a better defense help fix some of the starting rotation’s problems?
While waiting for baseball to return, I took a deep dive into some numbers and statistics, trying to find anything interesting to note. In case you didn’t know, the Pittsburgh Pirates possibly had the worst defense in all of baseball in 2019. Ranking dead-last (by 25 points…) in UZR and 7th-worst in DRS, the 2019 Pirates had many issues on defense. You already knew that, though.
These issues spanned from a drastic decline in performance from catcher Elias Diaz, to lack of improvement from guys like first baseman Josh Bell and third baseman Colin Moran. The loss of Gold Glove left fielder Corey Dickerson and subsequent use of defensive liability Melky Cabrera certainly didn’t help, either.
Only second baseman Adam Frazier, rookie star Bryan Reynolds, and undervalued catcher Jacob Stallings showed improvement on defense. That’s why the new front office, headed by GM Ben Cherington, started bringing in more defensive-minded players, like Jarrod Dyson and John Ryan Murphy. Guys like Cole Tucker and Ke’Bryan Hayes are also defensive studs waiting to fight for a role this season.
These defensive upgrades surely will help out the Pittsburgh Pirates pitching staff, but by how much? Can these upgrades help solve the starting rotations’ problems? Well, let’s take a look at what the data says.
I wanted to look at was the Pirates’ pitching as a whole over the past decade using xFIP, expected Fielding Independent Pitching. This is the best indicator of overall performance when it comes to pitching, accounting for ballpark differences on the long ball.
As expected, the Pittsburgh Pirates xFIP was sort of a roller coaster over this past decade:
Now, this only shows us what we already know. We knew the Pirates’ staff was incredible from 2013-2015, and that it was average-to-terrible in every other season. There isn’t an underlying stat out there that will tell you something different. What we can use this data for, however, is an analysis on the Pirates’ defense during those seasons. I’ll show you that in a second.
Before that, let’s take a look at the Pittsburgh Pirates defense over the past decade using the metric Ultimate Zone Rating (UZR). I won’t get into the fielding metric debate, but I prefer using UZR mostly to Defensive Runs Saved (DRS). Anyway, here is how the Pirates stacked up on defense since 2010:
The 2013-2015 teams again, as expected, along with 2017-18 prove to be the far superior defensive teams during this era, but overall the Pirates haven’t been the best (2009 has been their only positive UZR season since 2002).
Notice the first and last entries on the chart, 2010 and 2019. Now, you didn’t need this chart to tell you last year’s team was terrible on defense, instead notice that 2010’s team is actually worse than the 2019 team by around 3 UZR. That margin is much bigger under DRS, which lists the 2010 team at -80 and the 2019 team at -46.
As bad as last year’s defense was, that pre-Clint Hurdle defense was much, much worse. However, getting back to the pitching staff, I thought it was important to note the effectiveness of the defense during those years. One way to do that is by comparing UZR with batting average on balls in play (BAbip) and left on base (LOB) rates:
Once again we see the same type of peaks as the UZR graph, with the lowest being 2010 and 2019, and the highest peaks being 2013-2015 & 2017-18. Of course, UZR peaks in 2017 rather than 2018, but the numbers remain consistent. What about BAbip?
Again, similar peaks, his time we’re looking at the graph upside down. Now so far, we’ve only really looked at how the trend of the Pirates’ defense linked up with underlying pitching/defensive performance metrics. This only reinforces the relationship of defense and pitching, something which we all knew existed.
What I wanted to figure out, however, is whether or not just having a better defense could fix the Pirates’ pitching woes. Let’s go back to xFIP for a moment. Obviously this is a stat designed to take the defense out of the equation and focus solely on the pitcher. If we want to study the effects of defense (and luck, of course) on a pitcher, merely subtract ERA directly out of the xFIP.
Doing so, you should produce a graph such as this:
There it is folks, the graph we wanted. Compare this curve to the shape of the UZR curve and you should see nearly the same shape, with a little variance. More importantly, we can clearly see how the drastic differences in the Pirates’ defense from 2010 to 2011 and 2018 to 2019 had on the Pirates’ overall pitching performance.
This brings me to my conclusion. With the analysis above we can say two things for sure: 1) significant changes in defensive performance have a significant effect on pitching performance and 2) minor changes in defensive performance may have no effect at all. This is important because the Pirates have made a number of defensive upgrades over the off-season.
So what does this say about 2020? Well, if it happens, the Pittsburgh Pirates will still need to significantly improve the pitching staff as a whole in order to be competitive, however, if the new front office is able to make significant strides on defense this season, there will be improvement even if the pitchers find the same success.
