Pittsburgh Pirates: Best & Worst Average Seasons in Franchise History

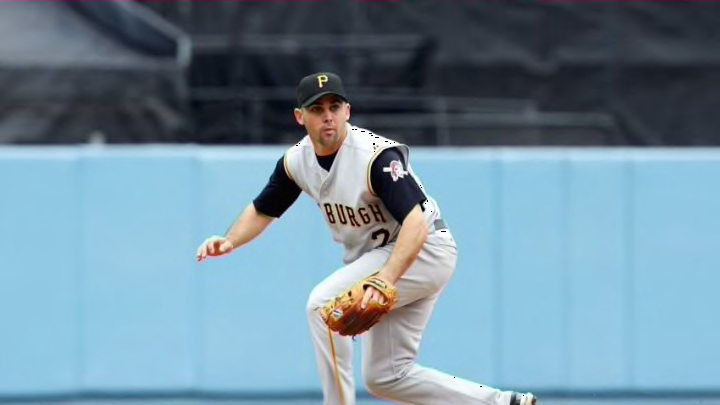
LOS ANGELES - APRIL 22: Jack Wilson # 2 of the Pittsburgh Pirates moves to field the ball against the Los Angeles Dodgers at Dodger Stadium on April 22, 2007 in Los Angeles, California. (Photo by Jeff Gross/Getty Images)
1 of 4
Next
PITTSBURGH, PA – MAY 10: A wide angle view during the game between the Pittsburgh Pirates and the Los Angeles Dodgers at PNC Park on May 10, 2022 in Pittsburgh, Pennsylvania. (Photo by Justin K. Aller/Getty Images)
PITTSBURGH, PA – MAY 10: A wide angle view during the game between the Pittsburgh Pirates and the Los Angeles Dodgers at PNC Park on May 10, 2022 in Pittsburgh, Pennsylvania. (Photo by Justin K. Aller/Getty Images) /

The Pittsburgh Pirates have had tons of average seasons in their history, but what are the best and worst average seasons in the franchise’s history?

There are plenty of measures to show how good or bad a player is in baseball. There is the elite of the elite who excel in nearly every statistical category and the poor who probably should be demoted to the minors.

There is a way to measure average in baseball. The best offensive statistic we have available to us is weighted runs created plus, or wRC+. This is a scale based on wOBA (weighted on-base average, an advanced version of OPS, but every type of hit (single, double, triple, homer), walk, and HBP is weighted to a specific amount and on the scale of OBP) where 100 is average. 101 is 1% better than average, and 99 is 1% worse than average, so on and so forth. It’s the most accurate offensive stat we have available because it’s based on wOBA, but more importantly adjusts for things like the run environment and park factors.

For example, it shows how you can compare a player from the Deadball Era to the Steroid Era. Although it isn’t a perfect stat, WAR can also show us what player is the closest to average. 2.0 WAR is usually considered the average. Zero is replacement level, not average and it’s adjusted for position. A slightly below average defensive shortstop is weigheted differently than an average defensive first baseman.

However, being average can always mean different things. You can bat .280 and be an average hitter because you don’t draw walks, nor do you hit for power, like Ahmed Rosario in 2021. You can hit .220 and strike out 30%+ of the time but still be an average hitter because you have a decent walk rate and/or hit for some pop, like Miguel Sano. You might have a sub-100 wRC+ and still have an fWAR around 2.0 because you’re that good at fielding and base running, like Michael A. Taylor in 2021.

There can be a good average player and a bad average player. The Pittsburgh Pirates have been around for a long time, and they’ve had plenty of good, bad, and average seasons throughout their history. Today, I want to look at who the best average seasons and worst average seasons have been in the franchise’s history. After that, let’s take a look at the most average seasons a Pittsburgh Pirates player has had in their time with the Pittsburgh Pirates.
Paul Waner of the Pittsburgh Pirates (Photo by George Rinhart/Corbis via Getty Images)
Paul Waner of the Pittsburgh Pirates (Photo by George Rinhart/Corbis via Getty Images) /

Best Seasons

In the history of the Pittsburgh Pirates there have been 23 seasons where a player had a wRC+ within 1% of average, so the 99-101 wRC+ range, and at least 500 plate appearances (not to be confused with at-bats). In all of these seasons, the best hitter is Earl Sheely’s 1929 campaign.

Sheely was the Pirates’ first baseman during the ‘29 season. He batted .293/.392/.392, leading to a .784 OPS and .369 wOBA. He has the second-best OPS among all of the average players and the best wOBA. He’s also the only player among these 23 with an OBP above .390. The only thing is he had a 99 wRC+, which makes him 1% worse than average, but still very close to the median.

The most valuable player in terms of WAR is Rennie Stennett, who had a 4.6 fWAR in 1975. Stennett hit .286/.324/.383 through 664 plate appearances. Stennett only had a .707 OPS and .323 wOBA which might not seem too impressive, but the league average OPS and wOBA in ‘75 were .701 and .321, respectively. This led to a 99 wRC+. Stennett was only about an average base runner, too, having just -.4 base running runs above average. Much of his value came as a defender at second base, where he had +21 total zone runs. That led all 2B’s by a margin of 4 TZR during that season.

So that’s the best average players in terms of wRC+, but what about fWAR? There have been 50 players who have fallen between the 1.8 and 2.2 fWAR margin. So going by wRC+, who is the best player who falls around an average fWAR? That would be Paul Waner in 1939.

The Hall Of Fame outfielder batted .328/.375/.438 with a .374 wOBA and 118 wRC+. That leads all 50 players who fall in this fWAR range. He also leads them all in wOBA by the smallest of margins. He only managed a 1.9 fWAR during this season, mainly because he was pretty mediocre with the glove. He had just -4 TZR, which bogged down his overall value.

PITTSBURGH, PA – 1982: Richie Hebner of the Pittsburgh Pirates bats during a Major League Baseball game at Three Rivers Stadium in 1982 in Pittsburgh, Pennsylvania. (Photo by George Gojkovich/Getty Images)
PITTSBURGH, PA – 1982: Richie Hebner of the Pittsburgh Pirates bats during a Major League Baseball game at Three Rivers Stadium in 1982 in Pittsburgh, Pennsylvania. (Photo by George Gojkovich/Getty Images) /

Worst Seasons

We looked at the best league average seasons and the most valuable average seasons. But on the other end, who owns the worst ‘average’ seasons and the least valuable average seasons? Look no further than Art Whitney in 1886.

Whitney batted for a .239/.315/.286 line, leading to a sub-.600 OPS, standing at .595, and wOBA of .294. They’re really not far off from Kevin Newman in 2020-2021, who hit .226/.268/.302, had a .570 OPS, and .250 wOBA. The only difference? Newman had a 54 wRC+, and Whitney had a 99 wRC+. The reason is the league average batter in 1886 had a .634 OPS and .303 wOBA. The league average batter over 100 years later in 2020-2021 had an OPS above .730 and wOBA above .315.

The least valuable league average hitting season comes from Richie Hebner in 1975. Hebner posted a .246/.319/.392 line, which fell right in line with the league average .258/.327/.374 batting line. However, while Hebner posted solid numbers at the plate, his defense fell flat. He had -13 total zone runs at the hot corner, the second least among all qualified defenders at third base. His defense brought his fWAR down to just .5.

The worst hitting season among the 1.8-2.2 fWAR group is a close decision between one of the most underrated defenders of all time, Jack Wilson in 2005, and Pop Smith in 1888. Wilson batted just .257/.299/.363, leading to a .288 wOBA (the third-worst mark) and 71 wRC+ (the worst mark). However, he had a +1.9 fWAR because he put up unbelievable numbers as a defender at shortstop. Wilson racked up +32 defensive runs saved while having +8.0 range runs above average and a +13.1 UZR/150.

If you want an example of how Gold Gloves are totally just a popularity contest, look no further than Wilson’s season. Since DRS has been recorded, his 2005 season is the 5th highest total and third-most among shortstops. Plus, he has just one of 13 seasons with a UZR/150 over +15. Yet he lost out to the Gold Glove to Omar Vizquel, who had +1 DRS and +6.5 UZR.150.

Hitting-wise, Wilson was pretty bad. So what did Pop Smith do in 1888? Smith only hit .206/.248/.270, leading to a .248 wOBA. Smith has a worse average, on-base percentage, slugging percentage, and weighted on-base average compared to Wilson in ‘05. So why is it so close? Well, it’s because he has a wRC+ 11% better than Wilson, coming in at 82. Batters in ‘05 were hitting .264/.330/.419, while batters in the late 1800s were hitting just .239/.291/.320. Technically, Smith was worse than Wilson, but only because ‘88 was much less hitter-friendly than ‘05.

Regardless of the run environment, an 82 wRC+ is pretty bad. Smith ended up with a 1.9 fWAR because he was still a plus defender up the middle. Smith split his time at shortstop and second base, racking up +5 total zone runs. His very good defense up the middle helped prop up his overall value.

SAN FRANCISCO, CA – AUGUST 12: David Freese #23 of the Pittsburgh Pirates bats against the San Francisco Giants in the top of the eighth inning at AT&T Park on August 12, 2018 in San Francisco, California. (Photo by Thearon W. Henderson/Getty Images)
SAN FRANCISCO, CA – AUGUST 12: David Freese #23 of the Pittsburgh Pirates bats against the San Francisco Giants in the top of the eighth inning at AT&T Park on August 12, 2018 in San Francisco, California. (Photo by Thearon W. Henderson/Getty Images) /

The Most Average Seasons

We took a look at the best average seasons, and the worst average seasons. But is there a player who truly exemplified the league average? Well there are three seasons to point out. The first is Warren Morris in 1999.

Morris batted .280/.360/.427, leading to a .347 wOBA, and 100 wRC+. Morris’ OPS was nine points above the average. His wOBA was just six points above the MLB average. Morris struck out 15.1% of the time, very close to the 16.4% rate of 1999. He also walked at a 10.2% rate, within 1% of the average. Morris’ defense up the middle was nothing to write home about either with +2 total zone runs at the keystone. The only thing he was truly below average in was base running with -2.6 base running runs above average. Between his hitting, fielding, and base running, Morris was worth 1.9 fWAR.

Now take a look at today is David Freese’s 2017 season. Freese batted .263/.368/.371, leading to a .739 OPS, .326 wOBA, and 100 wRC+. Freese’s OPS was below the league average mark of .750, but not massively so. His wOBA on the other hand was nearly spot on, with the league average mark being .321. His 23.1% strikeout rate was only 0.5% worse than the average. His walk rate of 11.5% was much higher than the league average mark of 8.5%. But his defense was great at third though, having +9 DRS and a 9.2 UZR/150. Base running wasn’t Freese’s strength, with -4.7 base running runs above average. But overall, he only had a 1.8 fWAR. He and Morris are the only two batters with a 100 wRC+ and fWAR within .2 of the average mark of 2.0.

Next. Let the Youth Movement Continue. dark

The last season we’ll look at today is Jay Bell’s 1990 campaign. Bell was a .254/.329/.362 hitter, which fell nearly in line with MLB average of .258/.325/.385. Bell had a .315 wOBA, the MLB average was .311. Bell’s OPS was .691. the league average was .710. Bell had just -0.6 base running runs above average. The only thing he did noticably below average is defense with -11 total zone runs at shortstop. But once you adjust for position, he put up a 2.0 fWAR.

Next