Worst Seasons
We looked at the best league average seasons and the most valuable average seasons. But on the other end, who owns the worst ‘average’ seasons and the least valuable average seasons? Look no further than Art Whitney in 1886.
Whitney batted for a .239/.315/.286 line, leading to a sub-.600 OPS, standing at .595, and wOBA of .294. They’re really not far off from Kevin Newman in 2020-2021, who hit .226/.268/.302, had a .570 OPS, and .250 wOBA. The only difference? Newman had a 54 wRC+, and Whitney had a 99 wRC+. The reason is the league average batter in 1886 had a .634 OPS and .303 wOBA. The league average batter over 100 years later in 2020-2021 had an OPS above .730 and wOBA above .315.
The least valuable league average hitting season comes from Richie Hebner in 1975. Hebner posted a .246/.319/.392 line, which fell right in line with the league average .258/.327/.374 batting line. However, while Hebner posted solid numbers at the plate, his defense fell flat. He had -13 total zone runs at the hot corner, the second least among all qualified defenders at third base. His defense brought his fWAR down to just .5.
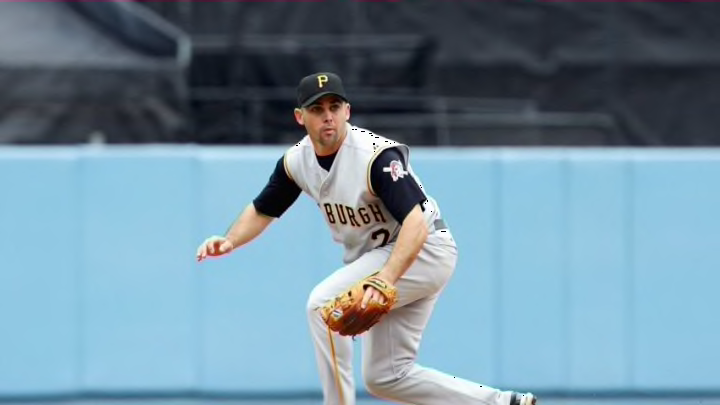
The worst hitting season among the 1.8-2.2 fWAR group is a close decision between one of the most underrated defenders of all time, Jack Wilson in 2005, and Pop Smith in 1888. Wilson batted just .257/.299/.363, leading to a .288 wOBA (the third-worst mark) and 71 wRC+ (the worst mark). However, he had a +1.9 fWAR because he put up unbelievable numbers as a defender at shortstop. Wilson racked up +32 defensive runs saved while having +8.0 range runs above average and a +13.1 UZR/150.
If you want an example of how Gold Gloves are totally just a popularity contest, look no further than Wilson’s season. Since DRS has been recorded, his 2005 season is the 5th highest total and third-most among shortstops. Plus, he has just one of 13 seasons with a UZR/150 over +15. Yet he lost out to the Gold Glove to Omar Vizquel, who had +1 DRS and +6.5 UZR.150.
Hitting-wise, Wilson was pretty bad. So what did Pop Smith do in 1888? Smith only hit .206/.248/.270, leading to a .248 wOBA. Smith has a worse average, on-base percentage, slugging percentage, and weighted on-base average compared to Wilson in ‘05. So why is it so close? Well, it’s because he has a wRC+ 11% better than Wilson, coming in at 82. Batters in ‘05 were hitting .264/.330/.419, while batters in the late 1800s were hitting just .239/.291/.320. Technically, Smith was worse than Wilson, but only because ‘88 was much less hitter-friendly than ‘05.
Regardless of the run environment, an 82 wRC+ is pretty bad. Smith ended up with a 1.9 fWAR because he was still a plus defender up the middle. Smith split his time at shortstop and second base, racking up +5 total zone runs. His very good defense up the middle helped prop up his overall value.
