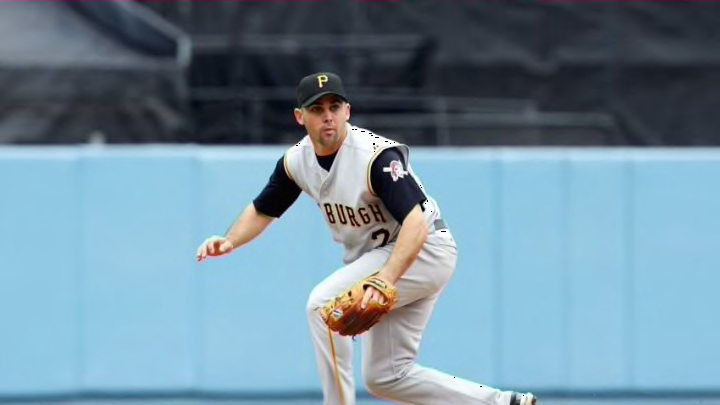
Pittsburgh Pirates: Best & Worst Average Seasons in Franchise History
By Noah Wright

The Most Average Seasons
We took a look at the best average seasons, and the worst average seasons. But is there a player who truly exemplified the league average? Well there are three seasons to point out. The first is Warren Morris in 1999.
Morris batted .280/.360/.427, leading to a .347 wOBA, and 100 wRC+. Morris’ OPS was nine points above the average. His wOBA was just six points above the MLB average. Morris struck out 15.1% of the time, very close to the 16.4% rate of 1999. He also walked at a 10.2% rate, within 1% of the average. Morris’ defense up the middle was nothing to write home about either with +2 total zone runs at the keystone. The only thing he was truly below average in was base running with -2.6 base running runs above average. Between his hitting, fielding, and base running, Morris was worth 1.9 fWAR.
Now take a look at today is David Freese’s 2017 season. Freese batted .263/.368/.371, leading to a .739 OPS, .326 wOBA, and 100 wRC+. Freese’s OPS was below the league average mark of .750, but not massively so. His wOBA on the other hand was nearly spot on, with the league average mark being .321. His 23.1% strikeout rate was only 0.5% worse than the average. His walk rate of 11.5% was much higher than the league average mark of 8.5%. But his defense was great at third though, having +9 DRS and a 9.2 UZR/150. Base running wasn’t Freese’s strength, with -4.7 base running runs above average. But overall, he only had a 1.8 fWAR. He and Morris are the only two batters with a 100 wRC+ and fWAR within .2 of the average mark of 2.0.
Next. Let the Youth Movement Continue. dark
The last season we’ll look at today is Jay Bell’s 1990 campaign. Bell was a .254/.329/.362 hitter, which fell nearly in line with MLB average of .258/.325/.385. Bell had a .315 wOBA, the MLB average was .311. Bell’s OPS was .691. the league average was .710. Bell had just -0.6 base running runs above average. The only thing he did noticably below average is defense with -11 total zone runs at shortstop. But once you adjust for position, he put up a 2.0 fWAR.