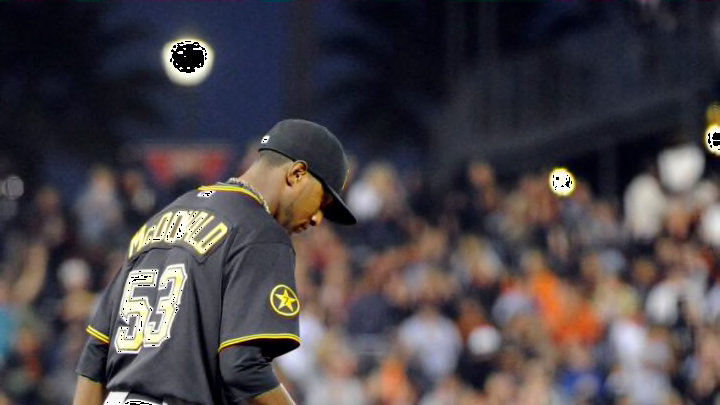
Jose Lind: July 26, 1990, to October 2, 1990
Jose Lind was never much of a hitter in his MLB career. Throughout his 4000 career MLB plate appearances, Lind turned in a poor .254/.295/.316 batting line. He had just nine home runs in 1044 games played and .610 OPS and .272 wOBA.
Once you adjust for league and park factors from the 1980s and 1990s, Lind had just a career 68 wRC+ and 70 OPS+. But Lind mainly was there for his defensive value. He racked up +33 total zone runs at the keystone with +6.6 defensive WAR while taking home the Gold Glove Award at second base with the Pittsburgh Pirates in 1992.
However, in 1990, Lind would have one of the worst 60-game spans in MLB history. From July 26 up through October 2, Lind posted just a .180/.230/.231 batting line, .196 wOBA, and 21 wRC+. A 21 wRC+ means he was 79% worse than the league average batter in 1990. 79% above league average in 1990 was somewhere between Jack Clark and Rickey Henderson.
Lind’s OPS of just .461 is the 133rd worst of all-time in a 60-game stretch. However, his wRC+ ranks as the 58th worst of all time. He only had a -1.1 fWAR, which is far from the worst but still well below replacement level. (Ironically, the worst 60-game fWAR comes from another Pirate, Ryan Doumit, who had a -2.8 fWAR from July 1 to September 15, 2008, despite league average hitting numbers).
While 1990 wasn’t a good season for Lind, it was far from his worst. He still batted for a .646 OPS, .278 wOBA, and 72 wRC+, which isn’t far off from his career norms. He posted a worse OPS in the two seasons prior and would go on to have four straight worse seasons per wRC+ from 1992 through 1994. Ironically, it was one of his better seasons with the bat. In the seven seasons, he had at least 300 plate appearances, his ’90 OPS ranks second, and both his OPS+ and wRC+ ranks third.
