Pittsburgh Pirates: Two Worst 60-Game Spans in Franchise History
Last week we took a look at the two best 60-game spans in Pirate history, now let’s look at the two worst 60-game spans in the team’s records.
The 2020 MLB season was shortened to just 60 games because of the COVID-19 pandemic. That few games are a minimal sample size as the Pittsburgh Pirates reached their 60th game this season on June 14. Small sample sizes can lead to some weird and outlier stats and numbers.
Because of how the 2020 season played out, FanGraphs created the 60-game split leaderboard, which shows the best and worst 60-game stretches in the history of baseball. Earlier this week, we looked at the two best 60-game sprints for the Pittsburgh Pirates; one batter and one pitcher.
Today, I want to revisit the 60-game leaderboard for Pittsburgh Pirates players, but instead, look at the worst seasons of all time. Once again, we’ll look at the worst 60-game sprint for a batter and a pitcher. With that explained, let’s get into our position player.
Jose Lind: July 26, 1990, to October 2, 1990
Jose Lind was never much of a hitter in his MLB career. Throughout his 4000 career MLB plate appearances, Lind turned in a poor .254/.295/.316 batting line. He had just nine home runs in 1044 games played and .610 OPS and .272 wOBA.
Once you adjust for league and park factors from the 1980s and 1990s, Lind had just a career 68 wRC+ and 70 OPS+. But Lind mainly was there for his defensive value. He racked up +33 total zone runs at the keystone with +6.6 defensive WAR while taking home the Gold Glove Award at second base with the Pittsburgh Pirates in 1992.
However, in 1990, Lind would have one of the worst 60-game spans in MLB history. From July 26 up through October 2, Lind posted just a .180/.230/.231 batting line, .196 wOBA, and 21 wRC+. A 21 wRC+ means he was 79% worse than the league average batter in 1990. 79% above league average in 1990 was somewhere between Jack Clark and Rickey Henderson.
Lind’s OPS of just .461 is the 133rd worst of all-time in a 60-game stretch. However, his wRC+ ranks as the 58th worst of all time. He only had a -1.1 fWAR, which is far from the worst but still well below replacement level. (Ironically, the worst 60-game fWAR comes from another Pirate, Ryan Doumit, who had a -2.8 fWAR from July 1 to September 15, 2008, despite league average hitting numbers).
While 1990 wasn’t a good season for Lind, it was far from his worst. He still batted for a .646 OPS, .278 wOBA, and 72 wRC+, which isn’t far off from his career norms. He posted a worse OPS in the two seasons prior and would go on to have four straight worse seasons per wRC+ from 1992 through 1994. Ironically, it was one of his better seasons with the bat. In the seven seasons, he had at least 300 plate appearances, his ’90 OPS ranks second, and both his OPS+ and wRC+ ranks third.
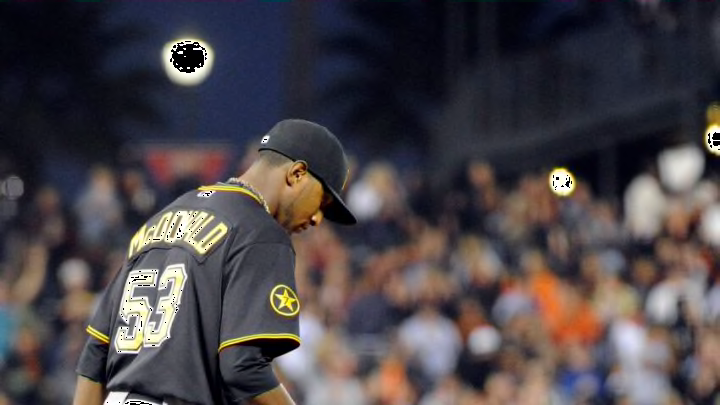
James McDonald: July 13, 2012, to September 14, 2012
The 2012 season is one that most fans likely aren’t too fond of, at least the second half. The Pittsburgh Pirates entered the 2012 All-Star Break with a 48-37 record with a firm grasp on a Wild Card spot and pushing for the division. Right-handed starter James McDonald was a big reason for the team’s first-half success.
McDonald entered the All-Star Break as an All-Star snub. In his first 110 innings of the season, Mcdonald had a 2.37 ERA, 3.00 FIP, and a WHIP below 1.00, coming in at 0.97. Mcdonald held opposing batters to a batting average below the Mendoza Line (.196) and OPS well below .600, at .570. He was pitching like a low-key Cy Young candidate.
McDonald had the fifth best ERA in baseball and 9th best FIP. Only 24 pitchers reached the 2+ fWAR mark by the 2012 All-Star Break and McDonald was one of them with a +2.7 mark (which ranked 11th in MLB and 7th in the NL at the time).
However, just like the rest of the Pirate roster, McDonald imploded in the second half of 2012. His next 61 innings yielded a 7.08 ERA, 6.06 FIP, and 1.74 WHIP. After keeping opponent bats almost utterly silent in the first half, they put up a .907 OPS vs. the right-hander in the second half. On average, he nearly gave up two home runs every nine innings with a 1.92 HR/9 rate.
McDonald’s ERA- of 185 is nearly as bad as Bob Walk’s 186 ERA- in a 60-game stretch that lasted from July 24 through September 24 in 1993. While McDonald’s strikeout rate is nearly twice that of Walk’s, his walk rate is 3% higher at 13%, and his FIP- is 12% worse. 2012 was a very disappointing year all around, especially for McDonald. He came out of the gates looking like a top 10 pitcher in baseball, only to fold in the second half, along with the rest of his team.