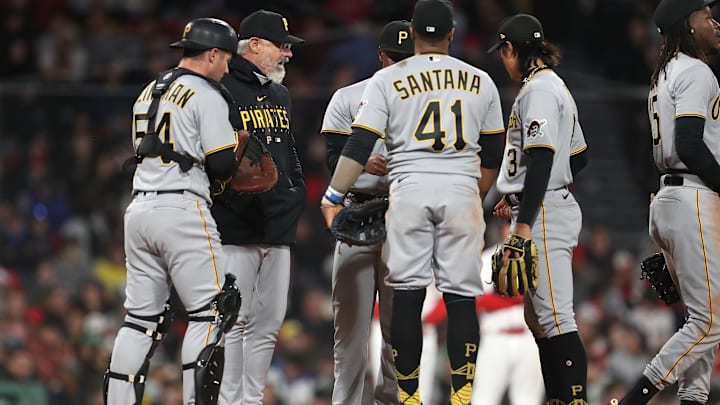
The Pittsburgh Pirates 1st inning struggles are odd considering that they seemingly rebound quickly and effectively afterward
The Pittsburgh Pirates have been a pretty decent team to watch this year. Sure, they are in a rough patch and have lost 8 of their last 9 games, but they’re still 21-16 and at the top of the NL Central at the time of writing this. However, there’s one strange area in which they struggle in, and that’s the 1st inning.
The Pirate pitching staff seemingly cannot go unscathed in the first inning. Of the 134 total earned runs they had allowed entering play on May 9th, 29 originate from the 1st inning. That means that over 20% of their total earned runs is from the very 1st inning of the game.
The Pirate staff has a 7.46 ERA, 1.80 WHIP, and 5.30 FIP as a collective unit in the first. Although their 22.3% strikeout rate and 9.6% walk rate aren’t too far off from the league average, batters own a 1.80 HR/9.
As a staff, the Pirates aren’t a bad home run prevention team either. They have a 0.96 HR/9 rate, which is slightly better than the league average. In total, they’ve allowed 33 dingers in 309.2 innings. Seven are from the 1st inning, which again is over 20% of their total home runs allowed.
What’s odd is the Pirates seem to not have these sorts of struggles in any other inning. After the 1st, Pirate pitchers settle down, with a 2.74 ERA, 3.38 FIP, and 1.14 WHIP in the second frame. Their strikeout rates go up (25.7%), and walk rates go down (7.6%), as does their HR/9 rate (0.80). That’s a massive 4.99 difference in ERA between the first inning and the second inning.
The next worst inning Pirates pitchers have is the 3rd inning. However, they’re still not nearly as bad in comparison. Pirates pitchers in the third inning have a 4.89 ERA, 4.55 FIP, and 1.46 WHIP when the third frame rolls around. Sure, their strikeout rate is lower at 16.8%, but so is their walk rate at 9% and HR/9 at 1.00.
Between the second inning and 9th inning, Pirate pitchers own a solid 3.43 ERA, 3.90 FIP, and 1.29 WHIP. Sure, their strikeout rate of 22.5% and 9.1% aren’t overly impressive, but they are averaging less than one home run every nine innings. In the first inning, Pirates pitchers have an ERA more akin to a position player being put in to soak up an inning. After the first, they pitch like what would generally be considered a no. 2 starting pitcher.
So what is causing this massive shift in performance? Luck does have a hand to play here. Pirates pitchers have a .381 batting average on balls in play in the first. They also have a 14.6% HR/FB ratio. Sure, FIP and xFIP do not paint the Pirates’ first-inning struggles positively, but they’re significantly better than their ERA. FIP comes in at 5.30 while xFIP pins them at 4.88. That’s more on par with the league average 1st inning FIP (4.57) and xFIP (4.49).
Dating back to 2002 (the furthest back FanGraphs’ split leaderboard goes to), the 2023 Pirates are the worst first-inning team among the 22 total seasons on record, per ERA and opponent wOBA (.410). However, they also have the highest BAbip. This all isn’t to say the Pirates are going to start shutting down opponents in the 1st inning from here on out if they just get better luck, but just to point out an oddity in the 2023 Pirates.
